Skip to content
The Solution

CFD Simulation for Taxonomy Compliance

The EU Taxonomy demands "high-resolution, state-of-the-art climate projections." Computational Fluid Dynamics delivers exactly that - at the building level, with quantitative, reproducible results.

The Challenge

Standard climate assessment methods have limitations that CFD addresses.

Weather Station Data

It covers regional averages. A station 5 km away cannot capture the wind tunnel between your buildings or the heat pocket in your courtyard.

Checklist Approaches

At best qualitative. "Is the site near water?" does not quantify flood risk. "Are there trees?" does not measure cooling effect.
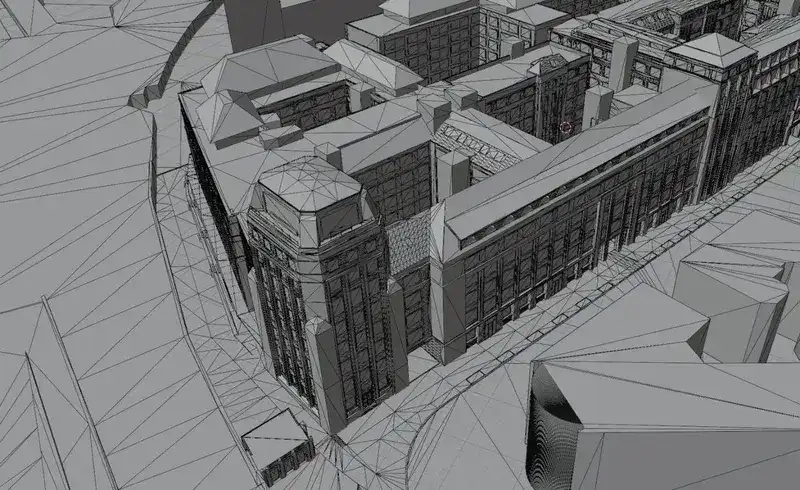
Desktop Studies

Literature reviews and generic guidelines are useful for context, but they cannot account for the specific geometry and microclimate of your site.

What CFD Simulation Provides

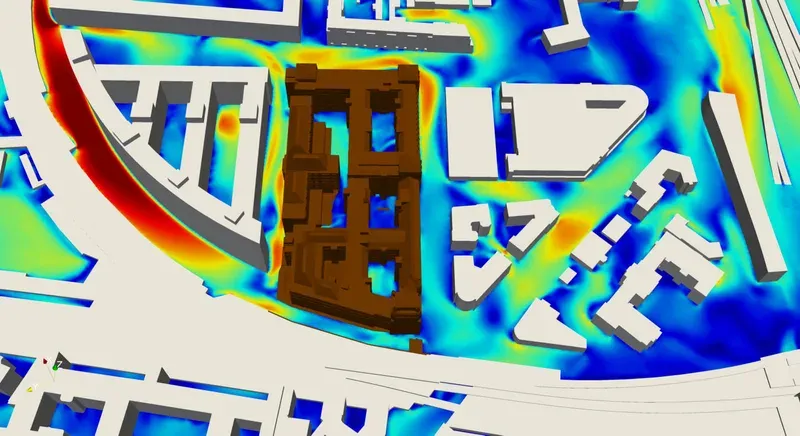
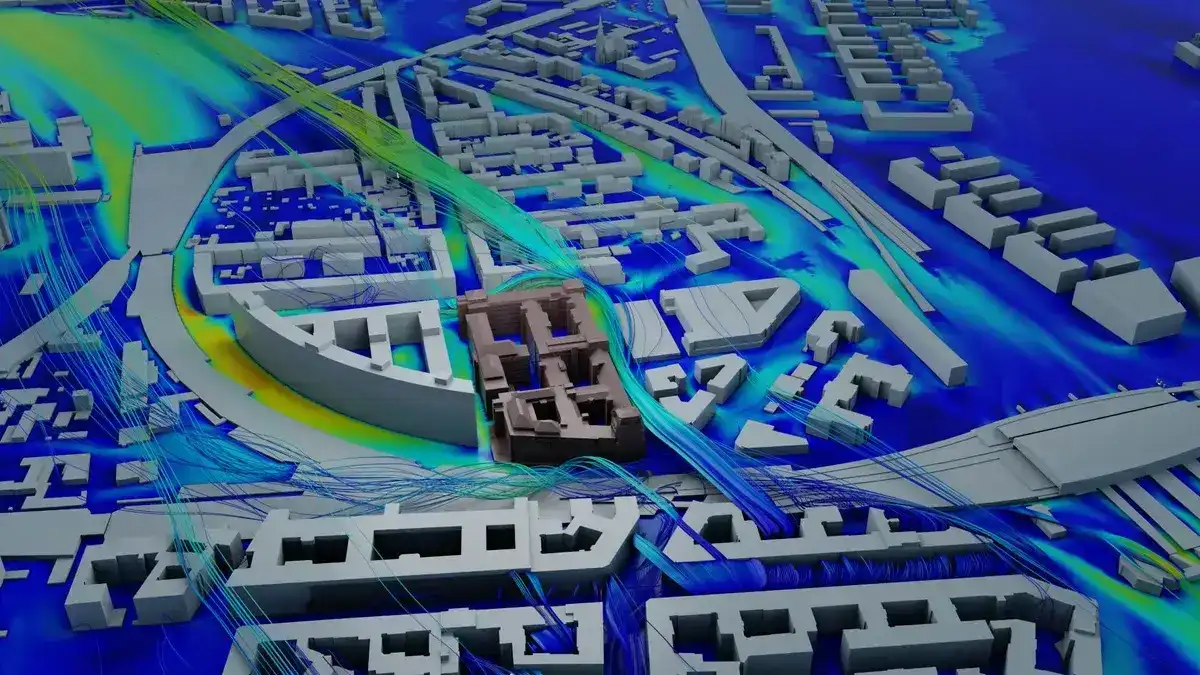
3D Wind Flow Analysis

Wind speed, direction, and turbulence at every point around your buildings. Identifies wind tunnels and calm zones.

Thermal Comfort

Quantitative assessment of heat stress in outdoor areas, including PET and UTCI indicators.
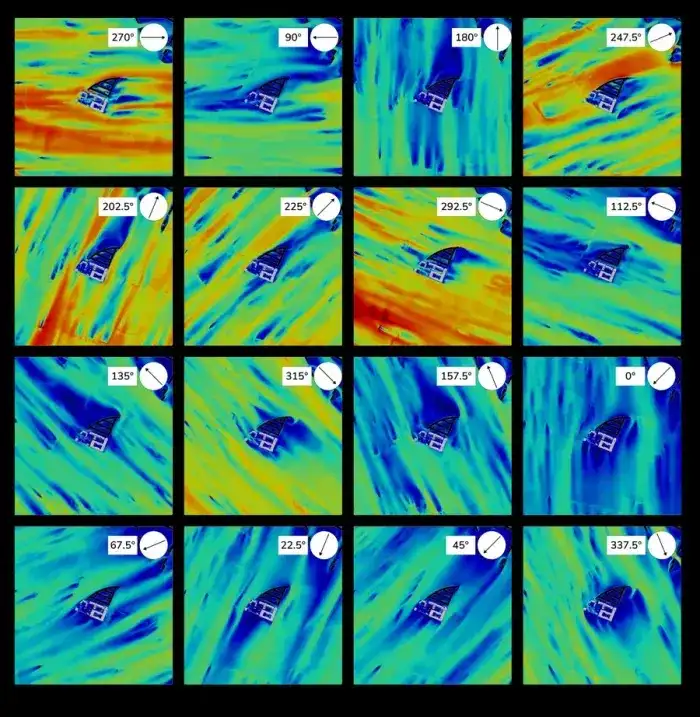
Scenario Testing

Compare baseline and adaptation scenarios, including green roofs, trees, shading, or revised massing.

Auditor-Ready Evidence

Reproducible outputs, maps, and reports suitable for CRVA documentation and audit review.

Where CFD Fits in the Taxonomy

CRVA Step 2: Assess risks
Provides the high-resolution analysis needed for heat stress and urban microclimate exposure.
Substantial contribution: Prove effectiveness
Shows quantitatively that the proposed adaptation measure reduces the identified risk.
CRVA Step 4: Assess adaptation solutions
Compare baseline versus adapted scenarios with measurable metrics.
DNSH: No adverse effects on others
Simulation shows that your measures do not worsen conditions for neighbouring sites.
NBS evaluation: Quantify before building
Test green roofs, trees, and cool surfaces before spending on implementation.

Manual Assessment vs. CFD Simulation

Manual / Checklist

Spatial resolution
Regional (km)
Urban heat island capture
Not captured
Wind analysis
Generic wind data
Scenario testing
Single baseline
NBS evaluation
Qualitative estimates
Auditor confidence
Low to medium
Maladaptation check
Difficult to prove
Repeatability
Manual each time
Cost
Lower upfront
Turnaround time
Days

CFD Simulation

Spatial resolution
Building-level (m)
Urban heat island capture
Full UHI modelling
Wind analysis
3D wind flow patterns
Scenario testing
Multiple what-if scenarios
NBS evaluation
Quantitative impact metrics
Auditor confidence
High (reproducible)
Maladaptation check
Simulated and verified
Repeatability
Automated reruns
Cost
Moderate (pay-per-use)
Turnaround time
1-2 weeks

Where taxonomy alignment and financing depend on it, CFD provides the higher-confidence evidence path.

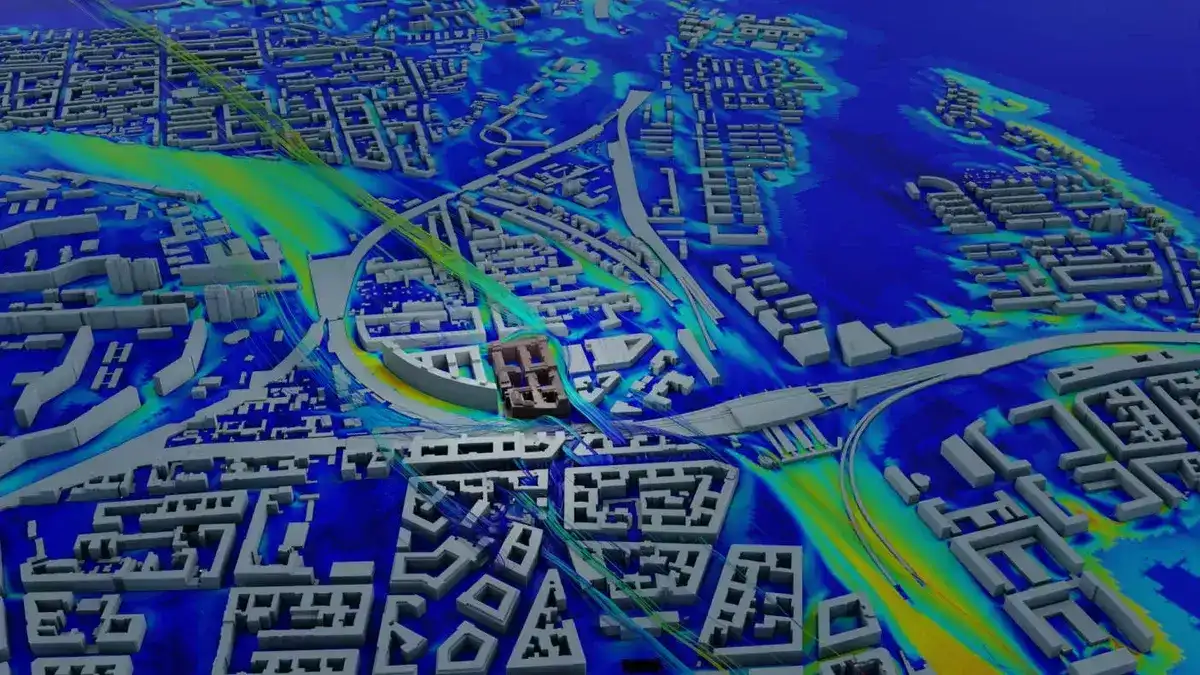
Simulation Results in Practice

Real CFD analysis for pedestrian wind comfort around urban buildings, powered by the dicehub platform.

Velocity field close-up around buildings3D building geometry wireframeCFD results for 16 wind directions
CFD streamlines showing wind flow around buildings

dicehub - Cloud CFD for Sustainable Cities

dicehub is a cloud-based CFD platform that makes microclimate analysis accessible. No software to install and no hardware to maintain - run simulations from your browser.

Cloud-based - runs in your browser and scales to any project
Pre-configured templates - urban wind and thermal comfort ready to go
Pay as you go - pay only for the simulation time used
OpenFOAM-based - industry-standard open-source CFD solver
Collaborative - share results with stakeholders and auditors
Multi-cloud - AWS, Azure, Google Cloud, Hetzner, or on-premises

Frequently Asked Questions